Kuzzle Hypervision
Energy consumption

Energy management has become as much an obligation as an opportunity. The French Tertiary Decree and BACS Decree, decarbonisation pathways and price volatility have made consumption monitoring a must for every property manager. Yet most organisations still rely on scattered readings in spreadsheets, invoices that are hard to reconcile, and Enedis or GRDF data used only occasionally.
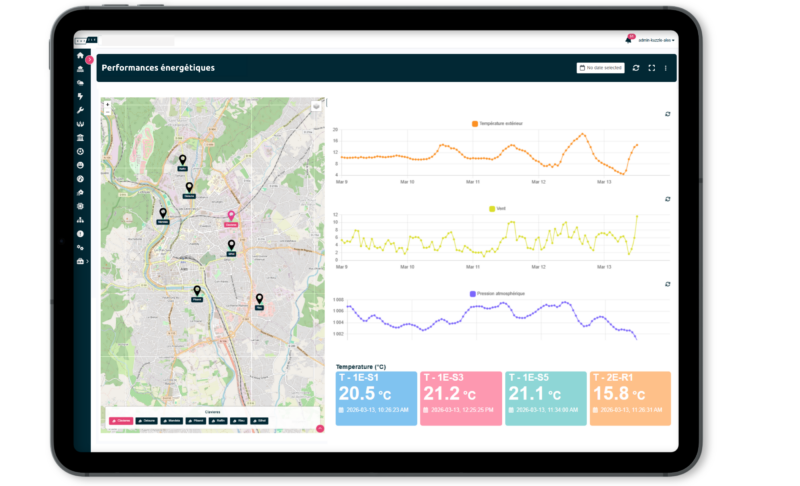
The real challenge is not collecting meter readings, but turning them into comparable indicators, cross-referencing them with comfort and occupancy data, and alerting the right teams at the right time. That is the role of Kuzzle Hypervision: a single repository for electricity, gas, water and renewable generation, reliable data, scenario-based alerts and automated reports tailored to your organisation. And because hypervision is multi-domain, energy monitoring for your buildings sits alongside street lighting, water and air quality in the same tool, whether you manage the portfolio of a local authority, an industrial group or a commercial property manager.
A challenge shared by every property manager
Whether the goal is compliance, lower energy bills or better-informed renovation decisions, every organisation with a building portfolio is concerned.
They trust us










Lower costs, faster response, compliance under control
Unified consumption monitoring works on three levers: your energy bill, cut by 10 to 30% on average by detecting anomalies and controlling equipment; your organisation, with alerts routed to the right teams; and regulatory compliance (Tertiary Decree, BACS Decree, OPERAT), fed continuously rather than rebuilt every year.

Des factures réduites par la détection des dérivLower bills through anomaly detectiones
Spotting abnormal consumption within days rather than when the annual bill arrives makes the difference between a quick fix and months of avoidable costs. Regular meter tracking combined with dynamic thresholds identifies equipment left running out of hours, declining boiler efficiency and hidden overconsumption. According to the ACEEE, energy management systems deliver average savings of 10 to 30%, and up to 50% for the least efficient buildings.

Teams alerted effectively, in line with your organisation
An alert is only useful if it reaches the right person, with the context needed to act. Kuzzle Hypervision routes alerts by profile: the technical operator for a boiler fault, the energy manager for a budget overrun, management for a consolidated report. Each team gets information at its own level of detail, without being swamped by raw data.
Regulatory obligations met without extra workload
Tertiary Decree, BACS Decree, OPERAT declarations, carbon footprint reporting: these obligations require data that must be consolidated, stored and exported. On a single platform, this work becomes a by-product of day-to-day monitoring: kWh/m² and kWh/HDD indicators calculated continuously, progress against targets visible at any time, reports ready to export.
We use the Kuzzle platform for our data reporting projects, and we are completely satisfied with it. Its robustness, flexibility and ability to manage real-time data flows make it a tool that is particularly well suited to our industrial and IoT challenges.
”From meter to action, a unified data chain
Monitoring consumption is about more than reading meters. Diverse data sources, multiple scales (equipment, building, portfolio, territory) and varied operating profiles make this a project whose value depends above all on data quality.
Existing data: Integrate your property repository
The first step is to import your building database (floor area, use, year of construction, main equipment) and connect it to your existing sources: Enedis and GRDF data, the OPERAT platform, BMS, CMMS and weather data. This repository is what makes indicators comparable: without floor area or use, a kWh means nothing.
Kuzzle Hypervision structures this repository and gives you a unified view of your portfolio and its energy performance, with no re-keying and no spreadsheets.
IoT sensors & actuators: Bring all your consumption together
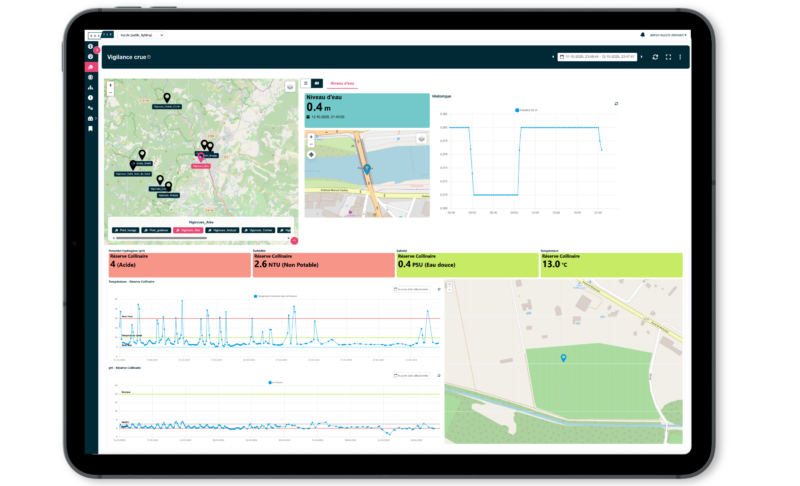
Connected electricity, gas and water meters, sub-metering modules, smart thermostatic valves, comfort and occupancy sensors: instrumentation complements utility data to cover uses that main meters miss, and to detect leaks.
Kuzzle Hypervision normalises, stores and validates these heterogeneous data streams, whatever the protocol (LoRaWAN, Modbus, BACnet, KNX, etc.). The platform ensures data continuity and links each reading to the right building, use and scale.
Kuzzle Hypervision platform: Analyse, alert and control from a single tool
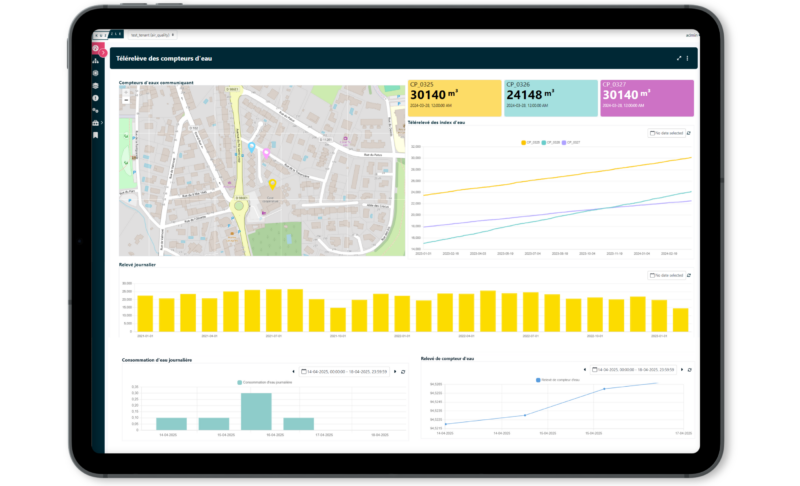
A BMS controls the equipment in one building. Kuzzle Hypervision sits above it: it brings together multiple BMS, meters and sensors from different manufacturers across all your sites, and cross-references readings with comfort, occupancy and weather data to calculate advanced indicators and route each alert to the right profile.
The platform adapts to your existing organisation (technical operator, energy manager, portfolio manager) with preconfigured, customisable profiles, dashboards and reports. Open source and hosted in France, it guarantees sovereignty over your data.
Let’s discuss your business challenges together!
At Kuzzle, every project starts with a conversation.
We take the time to understand your objectives, your constraints in the field, and your business priorities.
What makes the difference? A dedicated team that supports you from the initial question to the scaling-up phase.
Our experts help you clarify your priorities, identify your most impactful use cases, and structure your projects with complete confidence.
Your challenges are unique. Let’s discuss them together.
From meter readings to reporting: complementary uses
Where a single-purpose solution covers one use, a hypervision platform covers the entire energy value chain in one tool, from raw metering to regulatory compliance, and extends to other territorial services such as street lighting.
Meter reading analysis
Reading and tracking your main meters, via LoRaWAN sensors or Enedis and GRDF data, is the first step in energy monitoring.
Kuzzle Hypervision turns these readings into useful indicators: comparisons between buildings, trends over time, normalisation by floor area and use. You get a unified view of your portfolio without multiplying tools or spreadsheets.
Contextualisation with comfort data
A rise in consumption may be caused by a cold snap, a change of use or a technical fault: without context, there is no way to tell.
Kuzzle Hypervision cross-references readings with outdoor temperature, heating degree days, occupancy and actual building use to distinguish technical faults from normal variations. Your teams save valuable investigation time and produce more reliable analyses.
Consumption sub-metering
A main meter says nothing about how consumption breaks down by use: heating, hot water, lighting, IT, processes. Sub-metering allocates consumption by use and reveals priority savings opportunities.
In Kuzzle Hypervision, consolidated and detailed views sit side by side in the same interface, from building to equipment level, to inform your energy renovation decisions.
Programmation et pilotage de vos Equipment scheduling and control
Managing heating or ventilation according to actual occupancy and outdoor conditions, rather than a constant setpoint, delivers average savings of 28% (source: Dresden University of Technology).
Kuzzle Hypervision centralises the scheduling of your equipment (boilers, air handling units, lighting) and triggers automation scenarios based on occupancy, calendars and weather forecasts. Every action is tracked and logged.
Renewable energy and self-consumption monitoring
Solar PV roofs, biomass boilers, heating networks: portfolios are adding renewable energy, yet local generation is often missing from overall energy monitoring.
Kuzzle Hypervision collects generation data alongside consumption: self-consumption and self-sufficiency rates per site, trade-offs between grid export and self-consumption, actual return on installations. The consolidated generation/consumption view becomes a tool for steering the energy transition of your portfolio.
Street lighting consumption monitoring
A major item on municipal electricity bills, street lighting deserves the same level of monitoring as buildings. Sub-metering at control cabinets identifies energy-intensive circuits and the time slots when lighting can be dimmed without compromising safety.
In Kuzzle Hypervision, this data joins your building data for a complete view of energy spending across the territory. Learn more about street lighting
Common mistakes in energy monitoring projects
As with any project combining data and connected devices, the pitfalls are as much about governance as technology. From choosing indicators to integrating existing systems and getting teams on board, here is what to avoid for a successful energy management project.

Collecting data with no management objective
Without clear objectives, an energy monitoring project is just data collection with no impact. “Reducing consumption” is too vague: you need priority buildings (schools, offices, warehouses), measurable indicators (kWh/m², kWh/HDD) and realistic deadlines aligned with the Tertiary Decree pathway. Otherwise, the data will neither measure progress nor justify investment.
The most successful projects start with SMART objectives, for example cutting consumption by 20% across 5 pilot buildings within 2 years.

Overlooking existing data in favour of sensors everywhere
Many organisations already hold large amounts of data (Enedis, GRDF, BMS, invoices, OPERAT), but it is scattered, inconsistent or siloed across systems. Ignoring these sources leads to costly duplication: installing sensors where utility data would be enough.
Mapping available sources, standardising formats and bringing them into a single repository cuts costs and delivers reliable indicators faster. In most cases, existing data already generates savings before any sensor is installed.

Comparing buildings without context
Raw, unvalidated or uncontextualised data leads to flawed analysis. A rise in consumption may come from a cold snap, a change of use or a faulty sensor. Data must therefore be cleaned (outliers, gaps), enriched (floor area, occupancy, weather) and structured (units, timestamps).
Without this work, kWh/m² indicators and building comparisons remain unusable, and renovation decisions may be skewed.

Failing to define who does what with the data
Consumption data only creates value when the right people use it. Technical operators need real-time alerts to act on equipment, energy managers analyse seasonal trends to manage budgets, and management expects consolidated reports. Without designated owners or dashboard training, data remains underused.
Defining who handles alerts, who investigates and who decides is what turns data into action.

Taking a passive approach to alerts
Equipping meters, structuring data and providing dashboards only makes sense if alert handling is built into the daily routine of the teams concerned. Routing alerts by profile, managing acknowledgements and tracking actions matter as much as setting thresholds.
An overconsumption alert without a handling process is just a notification. With the right process, it becomes a saving.

Running a pilot too scattered to scale
A pilot phase is often recommended, but its scope is decisive for generating savings and convincing teams to roll out further. Proofs of concept that pile up use cases and sensor models on small volumes regularly overrun their budget and schedule.
By contrast, a trial on one or two use cases, with enough sensors to make a real difference to daily operations, helps teams see the potential and makes them want to extend the system.
Questions about energy management with Kuzzle?
Here are the answers!
What is the difference between a BMS and a hypervision platform?
A BMS (building management system) controls the technical equipment in a building. A hypervision platform such as Kuzzle Hypervision brings together multiple BMS, meters and sensors from different manufacturers across an entire portfolio, and adds analysis, alert routing and multi-site reporting.
Do you need to install sensors to monitor consumption?
Not necessarily at first. Enedis and GRDF data, invoices, OPERAT and existing BMS are often enough to produce initial reliable indicators. Sensors then cover uses that are not yet measured, such as sub-metering or comfort conditions.
Does Kuzzle Hypervision help comply with the Tertiary Decree?
Yes. The platform continuously calculates consumption indicators normalised by floor area and climate, tracks progress against the reduction pathway and prepares the data to be declared on OPERAT.
Can water and street lighting be monitored on the same platform?
Yes. Kuzzle Hypervision is multi-domain: electricity, gas, water, renewable generation and street lighting are all monitored in the same tool, with dashboards tailored to each team.
How can an energy monitoring project be funded?
Several programmes support French local authorities, such as ACTEE, run by the FNCCR, and the Green Fund (Fonds vert). Our teams can help you identify the funding available for your project.
Can we gradually add new features and services to Kuzzle?
Yes, the Kuzzle platform is scalable and allows for the addition of new use cases (mobility, environment, building management, etc.) as the local government’s needs evolve.
Why choose an open-source or vendor-neutral platform?
An open-source, vendor-independent solution ensures long-term sustainability, cost control, and data interoperability, while avoiding vendor lock-in.
Our lastest success stories

Smart City
Territorial hypervision platform
Real-time hypervisor for managing air quality and energy consumption in the Alès conurbation.

Smart City
Smart Building Management
The Côte-d’Or Department (21) deployed, in record time, a demonstrator for the monitoring and automation of public buildings

Smart City
Shared Data Platform for Morbihan Énergies
Morbihan Energies is pooling its data with Kuzzle’s interoperable data platform for its 249 member municipalities.
Expert support, clear indicators, measurable ROI.
At Kuzzle, we offer more than just a platform: we support you at every stage of your project, from defining your use cases to operational implementation and scaling up.
This approach guarantees you a solution that is truly tailored to your business challenges, capable of leveraging your data, streamlining your processes and producing concrete results.
Tailor-made support, closely aligned with your business realities.